LiDAR Sprint Profiling
Every sprint
Measured
The Way Speed LiDAR sensor gives you a complete velocity curve and split times to optimize your performance.
Get Early Access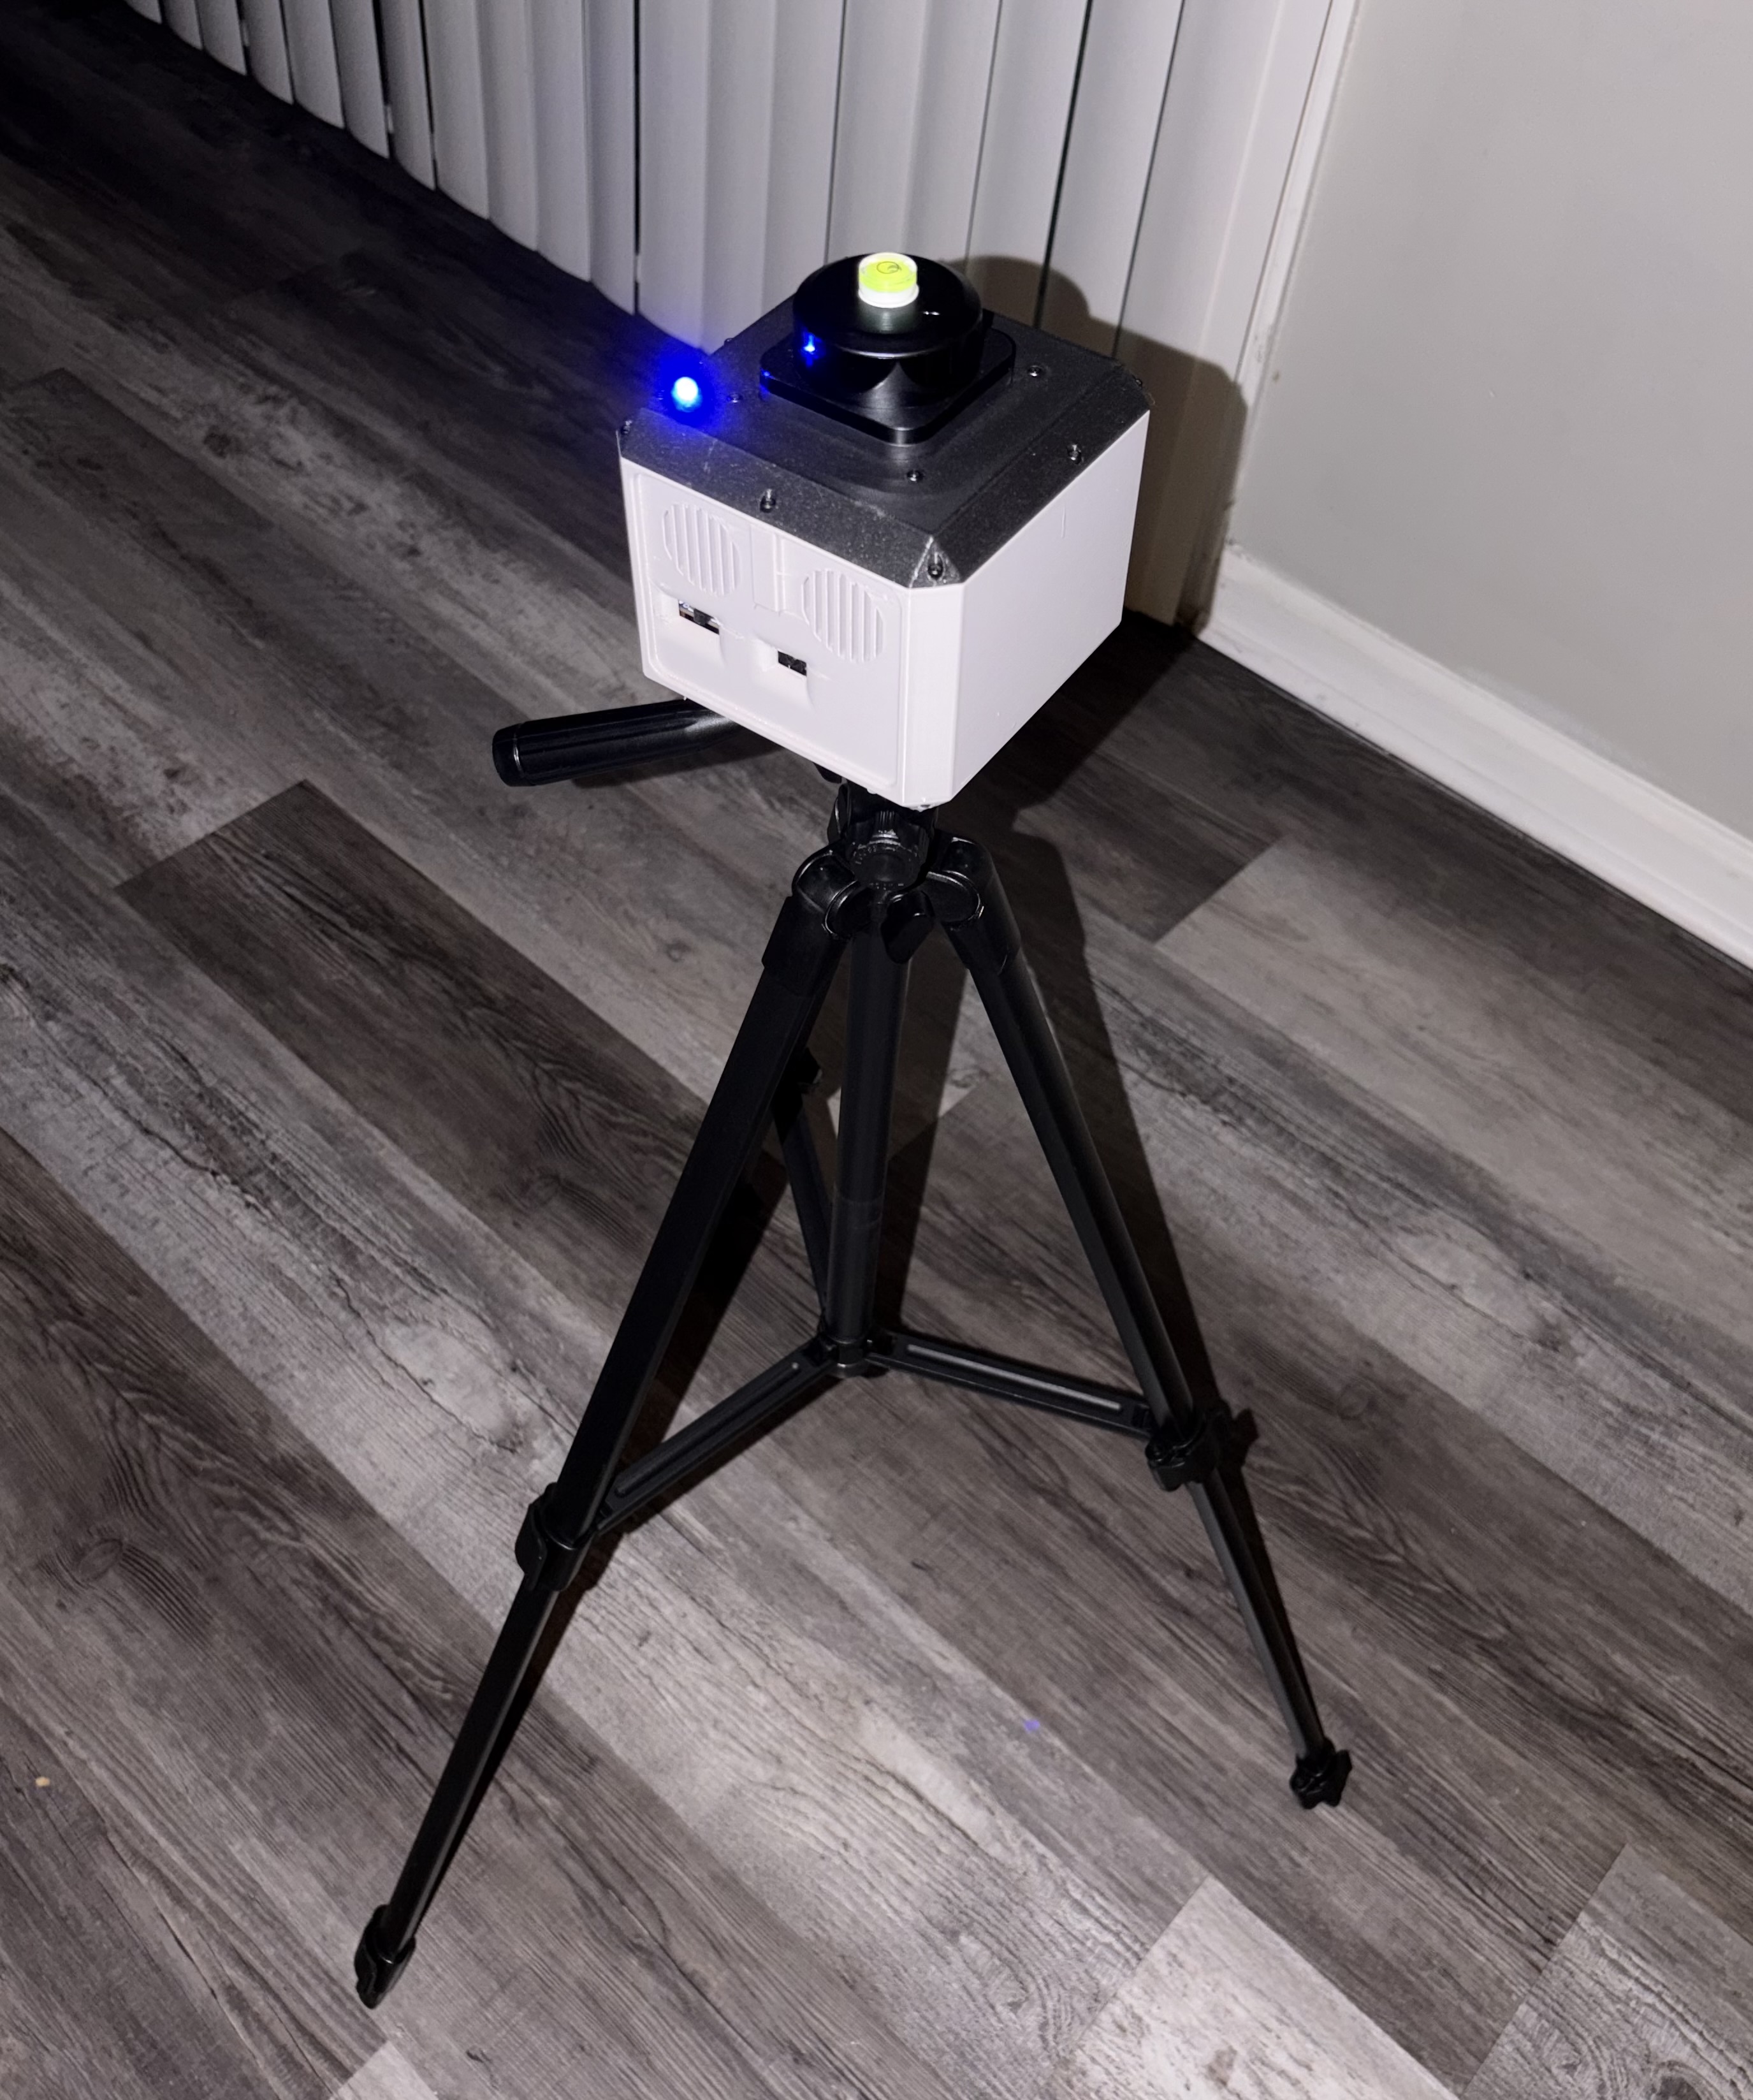
The Way Speed LiDAR sensor gives you a complete velocity curve and split times to optimize your performance.
Get Early Access
Standard laser timing gates only record split times. Reconstructing even a rough velocity profile takes many gates, which is costly and slow to set up.
The belt assists or resists the athlete throughout the run, so cable timing never captures a true, unaltered velocity profile. Traditional systems are also prohibitively expensive for the average program.
Wearable chips that use sensors can be inaccurate and inconsistent when running at high speeds, and they still would need many sensors to capture a velocity profile.
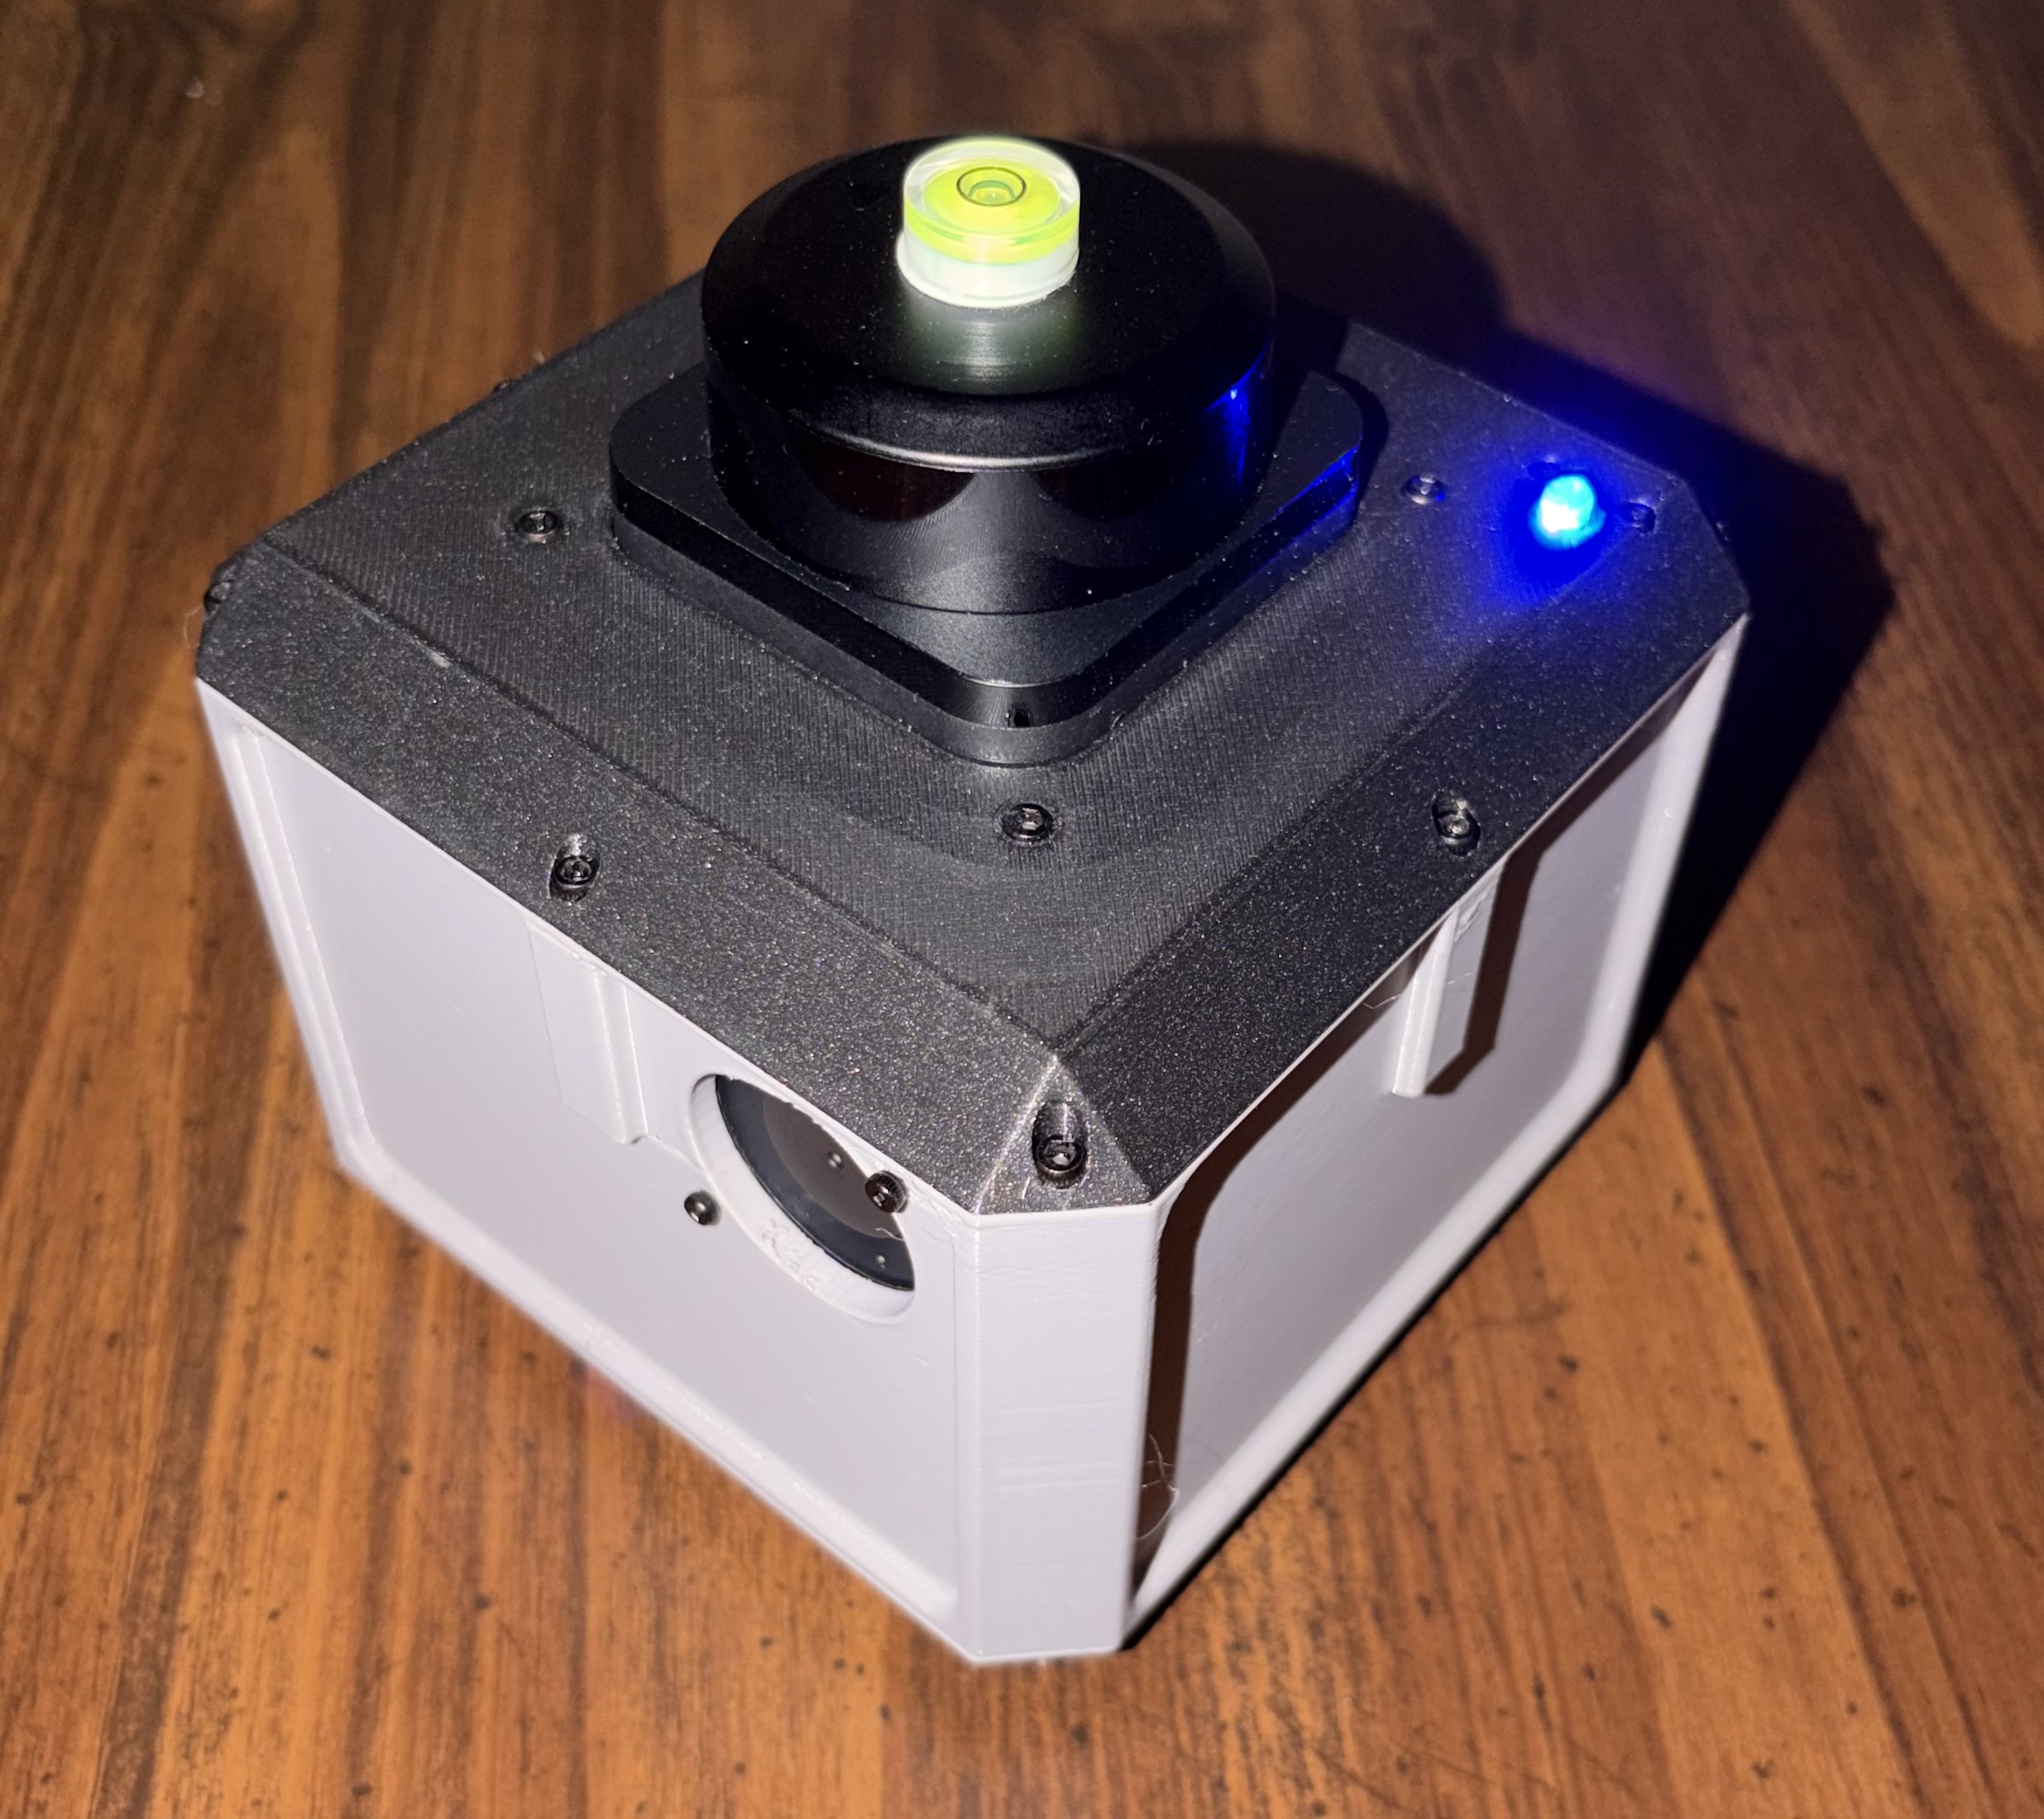
Using the same sensors as autonomous cars, our LiDAR sensor can be placed beside the track to continuously track an athlete's position through every meter of a sprint. With only one sensor to place, setup takes seconds.
Just position the sensor, choose someone to track, and press record. Your runs will output a full velocity curve, split times, and more the moment each run is done.
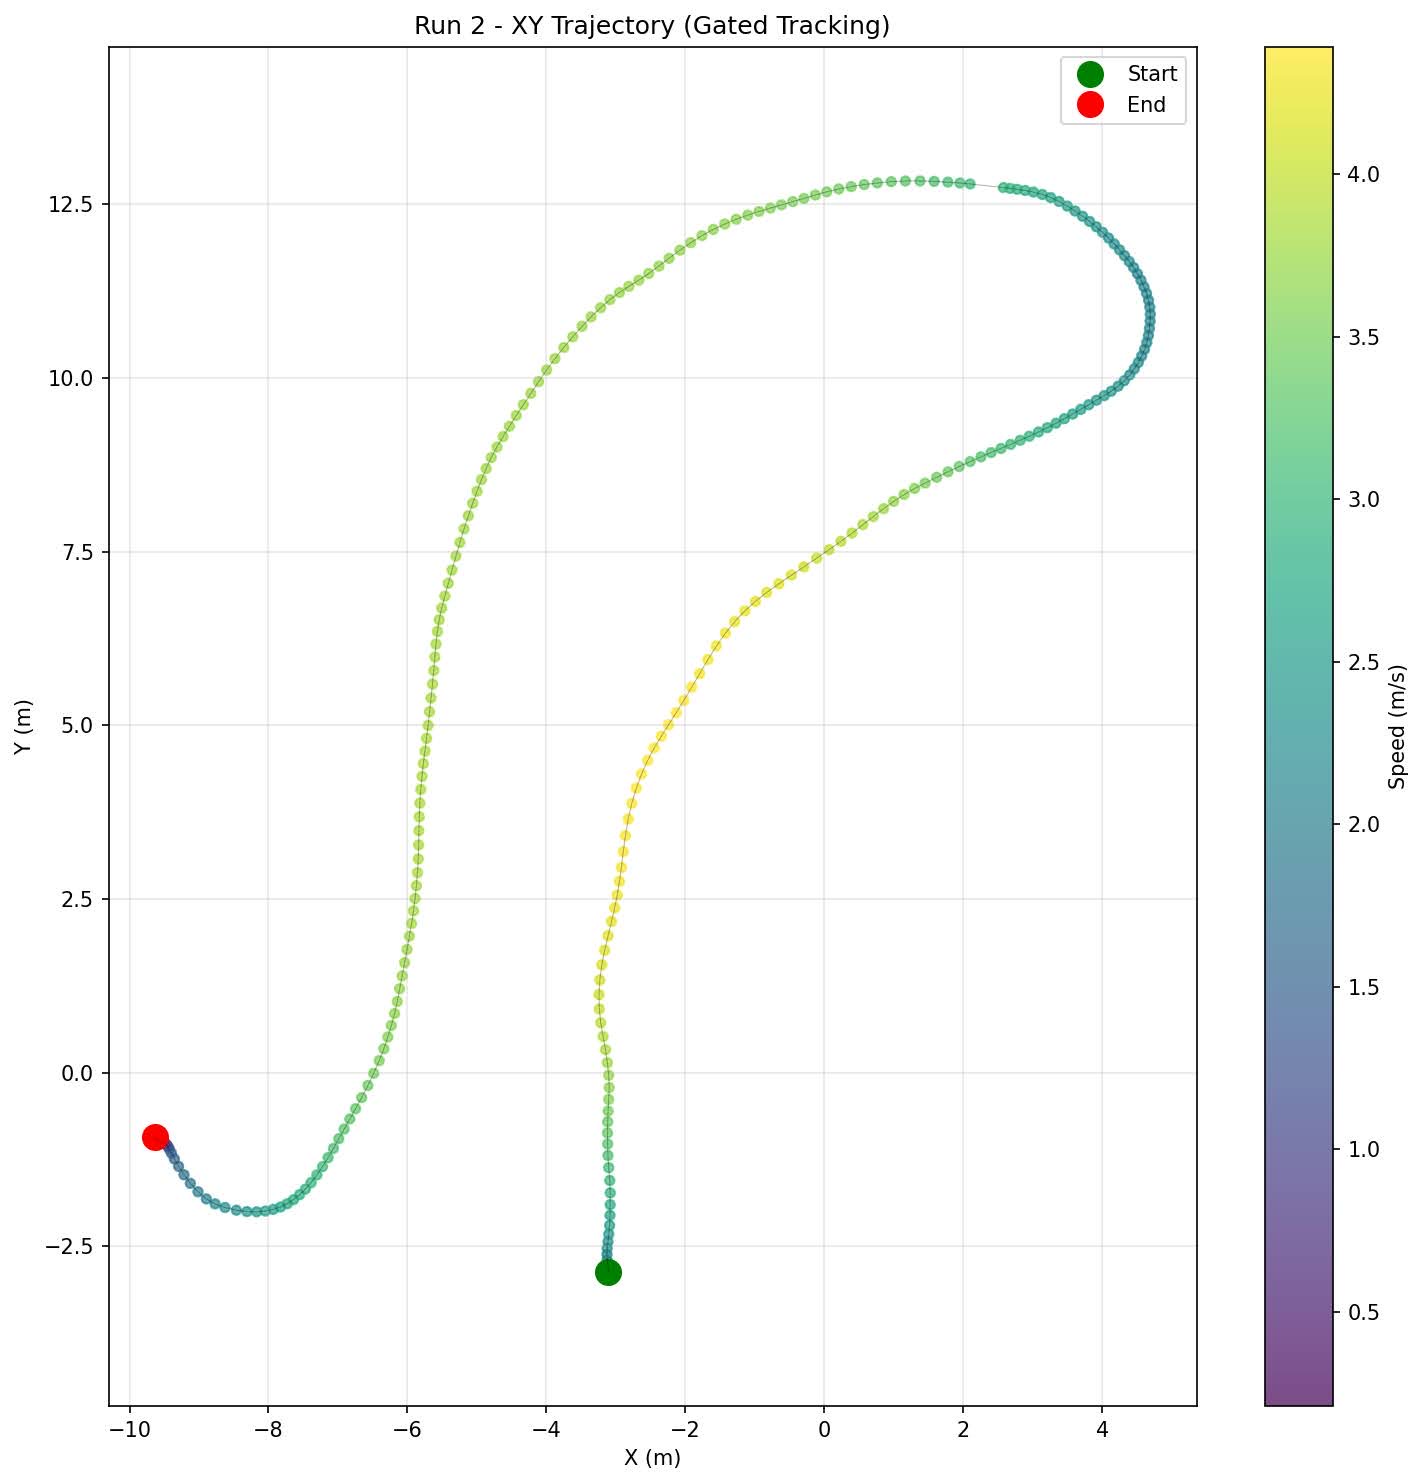
A complete velocity-over-time graph for every rep. See exactly how speed builds, where it peaks, and how it holds or falls through the final meters.
Automatic splits at every 5 or 10 m from the moment the sprint begins, with no timing gates, manual triggers, or extra hardware.
Connect the Way Speed app to your phone over Bluetooth to start and stop runs. Sprint data lands in a clean dashboard right after each rep. Review reps, compare athletes, and share results in a few taps.
Way Speed profiles the sprints you already coach, plus a few workouts nothing else can measure.
See the full drive phase, from how force turns into speed out of the start through the first 30 meters.
Capture true top-end velocity on flying runs, with the exact curve of how max speed is reached and held.
Back-and-forth shuttles and repeat efforts, each leg profiled and timed automatically.
In DevelopmentThe last few steps in the approach determine how much energy is going into the jump. Way Speed profiles the full runway, showing exactly how speed builds into the board or takeoff.
Timing gates can only measure the time over a certain distance. Our technology does this and more by providing the velocity each step of the way.
Traditional systems can only measure linearly. Because the lidar sees 360 degrees, it can even capture a high jump approach of an athlete on a curve.
A Way Speed velocity profile matches the reference sprint-velocity curves established in the biomechanics literature, with the same shape and the same phases, from a single trackside sensor.
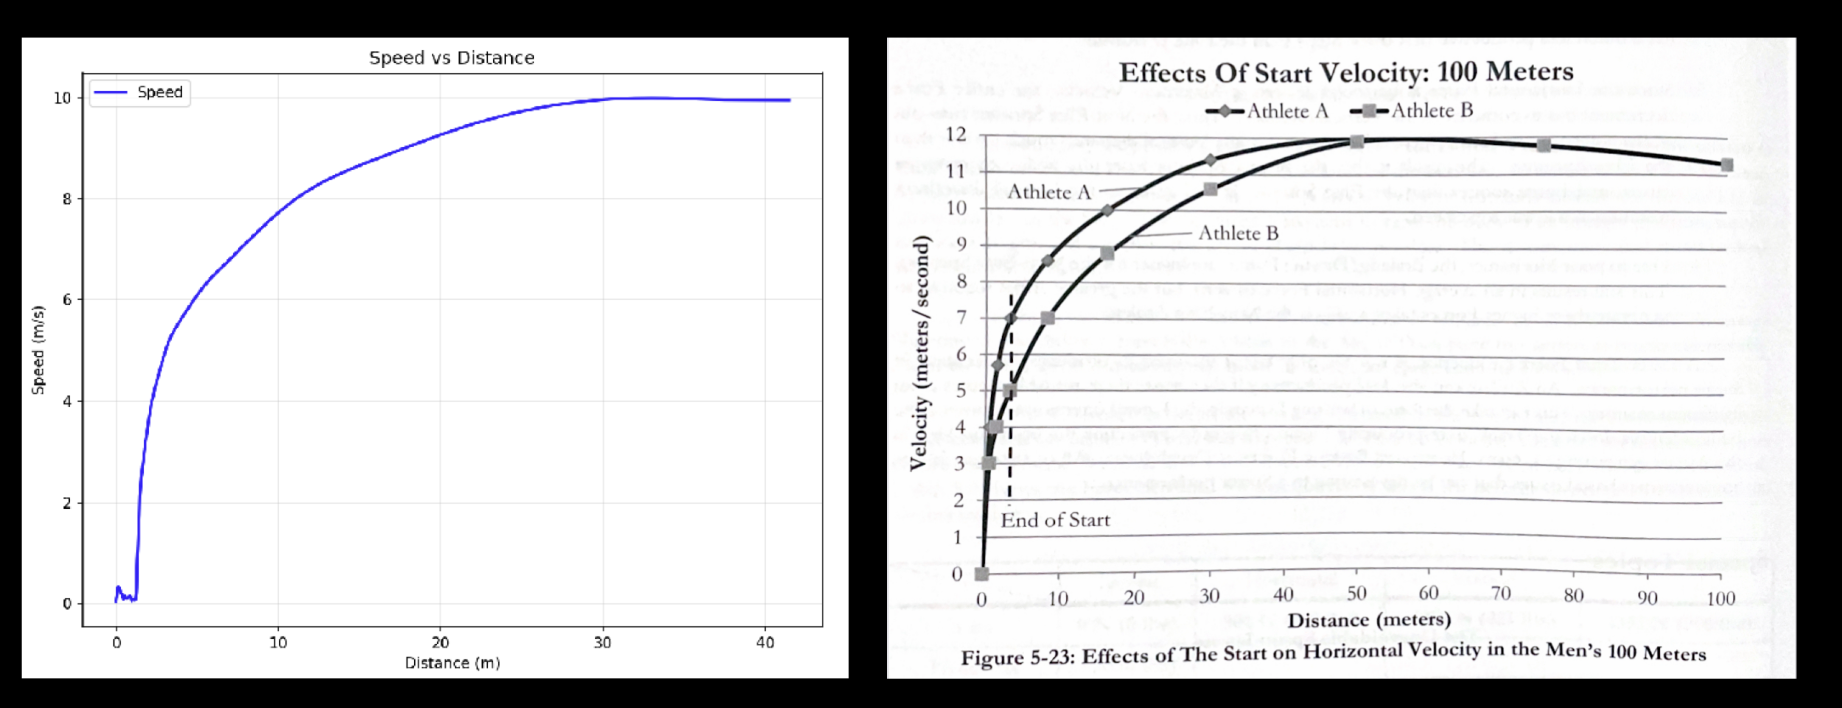
Reference profile: Mann, R. V., & Murphy, A. (2024). The mechanics of sprinting and hurdling (2024 ed.). Independently published.
One trackside sensor reads the athlete continuously across the entire sprint, turning a single run into a full stream of position, velocity, split data, and more.
Split and total times accurate to within three hundredths of a second.
Validated to within 0.2 m/s of a traditional cable timing system, across the full curve.
The athlete's position captured 15 times every second, start to finish.
Automatic splits every 5 meters from the first step, or customize the intervals.
A single unit covers a 60-meter zone, the whole sprint from one position.
One sensor that takes moments to set up, with no gates to interfere.
Get a Way Speed unit at a fraction of the launch price in exchange for real-world feedback from your program. You help shape the product, and you keep the hardware.
Reserve Your UnitWay Speed is in final development. Join the waitlist and we'll reach out when early access opens. We'll only email you about that.
Join the Waitlist